Use POS data in your supply chain to react faster to changes in demand
Sep 12, 2012 • 11 min
As part of my PhD, I carried out a study of the way companies handled their supply chain data. I found that by basing their warehouse forecasts on reorders from stores to the warehouse rather than factoring in frontline sales data, they were sometimes months behind the curve, losing sales and causing themselves a multitude of problems as a result.
Then, a few weeks ago I dusted off that doctoral dissertation from 2005. To my horror it reminded me that the problems I identified then are still problems today.
The area of my research that still seems all-too-relevant was about the different ways of reacting more quickly to changes in demand by using sales data from stores, known as point-of-sale (POS) data, in other stages of the supply chain. The idea was that by constantly following up sales at store level — keeping your finger on the pulse — it would be possible to identify changes in demand before these were visible in the order flow to the central warehouse and suppliers.
The idea was good, and the theory proved solid, but back then, there were few companies with the resources to make use of the massive quantity of POS data available to them. Most companies now seem to have realized the value of POS data and see it as an interesting future development area, with an emphasis on “future.” What many of them have failed to register is that the future has already arrived.
Developments within data management and calculation capacity have made the systematic, large-scale application of POS data within supply-chain management a reality. Companies within the retail trade in particular, which in many cases control both their stores and the supplying warehouses themselves, no longer have any excuse for letting POS data gather dust in the stores’ till systems. It is time to stop dreaming and put POS data to work instead!
Using POS data increases reaction speed
It is possible to measure the value of POS data in a meaningful way. In my doctoral dissertation, I examined a number of product launches by two well-known suppliers in the consumer goods industry. By analyzing POS data, the level of demand for the new products could be determined, on average, 30 days (and up to 100 days) faster than with access only to data from order flows from the stores to the central warehouse.
The difference in reaction speed was even greater — 61 days on average (and up to 128 days) — if the information value of POS data was compared to the information that could be read from the central warehouse’s order flow to suppliers.
There are many reasons for delays in the information flow but, where product launches are concerned, the most important factor is the safety stock initially created in each stage of the supply chain.
These buffers exist so that all parties can ensure they are able to meet demand. Furthermore, it is natural to stock at least one full retail pack per store and full pallets in the central warehouse. As the ‘days of supply’ for one pack is mostly measured in weeks, or even months (even within the consumer goods trade where talk of “fast moving consumer goods” is commonplace), it takes time before the safety stock is depleted to the point that it prompts a new order.
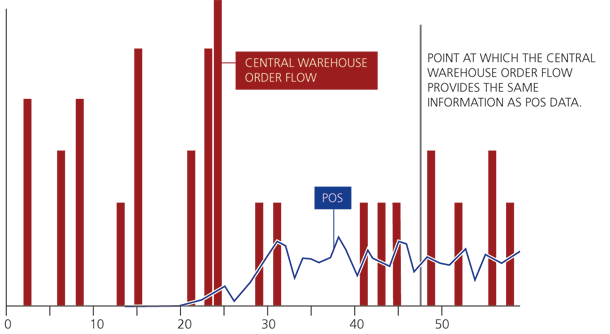
If you form your picture of product sales from the order data between stores and the central warehouse, then the profile you generate will look very different from that you get from POS data.
Let’s imagine a scenario where re-orders are conflated with sales. For a start you’ll see a large “sales” spike at the outset — as the warehouse ships initial stock to the store. Then — quite possibly for weeks — nothing. At the store, sales may be steady. But back at HQ, you don’t register that.
The natural reaction to this apparent lack of sales is to write off a product as a failure. Then re-orders start to flow and, because the product has been written off: panic. Figure 1 shows an actual example of how differently POS data and the order flow can appear.
POS data is the key, but requires a bit more effort
Today, our capacity for transferring and processing large quantities of data is completely different to that of 10 years ago. Analyzing sales data at product, store, and daily level is not especially difficult. For many retailers, this is simply part of everyday working life. (It is now also possible, at a reasonable cost, to process sales data at an even more detailed level, per receipt line, but we will not look at its applications here.)
It is clear that access to POS data speeds up the information flow in the supply chain and makes it possible to adapt stock levels and production to actual demand more quickly. In this context, I would also like to take the opportunity to issue a few words of warning: It is important to remember that regardless of everything else, the central warehouse and suppliers have to respond to the actual order flow.
If you simply take the POS data as it stands and use it as a forecast for the central warehouse or for the supplier’s stock, this may lead to stock levels which are out of phase with the actual supply need. For example, in the case of new items delivered in relatively large packs, using POS data as a forecast may lead to the central warehouse or supplier building up a large amount of stock extremely quickly. This is then not actually required until several weeks or months later. For items with a shorter life cycle or limited shelf life, this may lead to big problems with obsolescence.
In order to obtain the best possible forecast of future supply needs then, in addition to examining POS data to estimate the level of end-customer demand, you should also include safety stock already in the supply chain. You’ll also need to estimate how long it will take to reduce stock indicated as ‘excess’ and also consider lead times, delivery schedules and order multiples that create bunching in the order flow.
On top of all that you need to filter out any portion of demand created by campaigns and promotions.
“But that sounds complicated,” you say. Yes, thirty years ago it would have been, but now we have IT systems that free us to deal with the genuinely complicated things in life — like other people — while we leave the number crunching to computers!
Refine your POS data for order forecasts to achieve better control
By refining POS data for order forecasts, you reduce the uncertainty and the need for interpretation within the supply chain, while retaining the reaction speed.
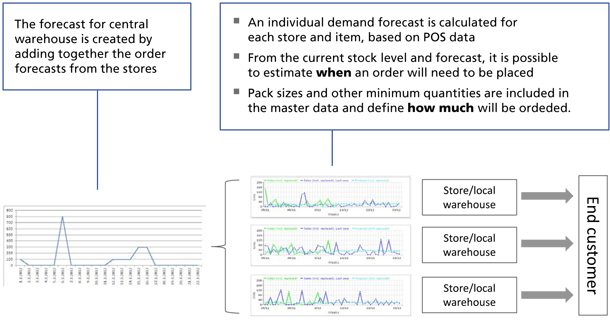
The order forecast provides the best possible estimate of when and to what extent an order need will occur in each individual store or warehouse. This means that the order forecasts, in contrast to unprocessed POS data, can be used directly by the following stage in the path (e.g. at the central warehouse) without any risk of building up quantities of stock that are out of phase with the actual supply need (see Image 2).
A good order forecast combines three different types of information:
- The end-customers’ predicted demand, updated on the basis of the latest POS data
- Stock on hand and replenishment orders already placed, and
- Information on the control parameters (safety or display stock, pack size or minimum order quantity plus delivery schedule or lead time) affecting the time and quantity of the orders.
The order forecast can therefore, despite its apparent simplicity, be seen as a highly advanced, distillation of all available information.
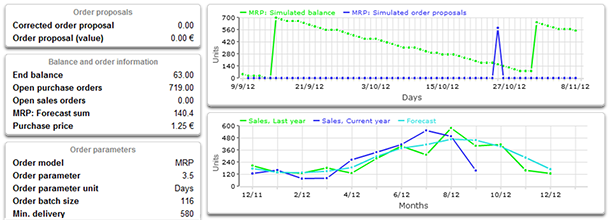
In practice, the calculation of an accurate order forecast requires an intelligent replenishment system. An intelligent replenishment system not only calculates the actual order need, but also simulates the order need in the future. Based on the latest POS-data-based forecast, and the parameters controlling the order, the system calculates future fluctuations in the stock balance and when new orders will need to be placed and received (see Image 3 for an example of simulated orders).
Simulation can, in principle, go as far ahead in time as you want, but the value of including information on current stock levels and control parameters is clearly greater in the short or medium term.
Simulation of the order flow also places high demands on both a system’s software and calculation capacity, although today’s IT solutions make this a challenge that can be overcome. For our customers, this type of calculation is carried out every day, several weeks or months in advance. In certain cases, the calculations are also made in several stages so that the order forecast for the stores or local warehouses feeds the order forecast for the central warehouse.
When is the benefit of order forecasts the greatest?
When the flow is stable and no changes occur, the difference between the order forecast and a forecast calculated from the central warehouse shipments is, as a rule, relatively small. But what proportion of products has a stable flow? Shorter product life-cycles, more flexible opening hours and a greater emphasis on seasonal ranges mean that the proportion of stable-flow items is constantly shrinking.
| Situation | The value of order forecasts |
| New product launches | When products are launched, an initial safety stock is often created in all stages of the supply chain (known as “pipeline fill”). Since part of the stock on hand must first be sold before orders are created, it may take weeks or months before the order flow from the stores corresponds to sales to end customers. Furthermore, the delay can vary greatly between different store concepts and regions, meaning that it is difficult to make a qualitative assessment of the effect. The order forecast is therefore of central importance in ensuring that stock levels at the supplying warehouses can be effectively matched with the actual supply need. |
| Product ramp-downs | When ramping down products, the store-specific order forecast automatically takes the item’s end date into consideration, as well as the fact that safety stock levels are generally decreased towards the end of a product’s life-cycle. The order forecast supports a controlled ramp-down of the stock levels at the central warehouse, and also makes it possible to identify potential cases of overstocking in the supply chain more quickly. |
| Marketing activities/Promotions | Just before campaigns and other marketing activities, a larger shelf display or safety stock is often built up in stores. After the campaign, there may be excess stock. The order forecast reacts automatically and quickly when demand generated by a campaign is higher or lower than forecast, while also making it possible to return more quickly to the correct stock level after the campaign. |
| Seasonal goods | Safety stocks are often created just before the season begins, and the speed at which these are used up can vary in different stores according to local conditions, such as the weather. The order forecast automatically considers demand and stock on hand in each individual store, which means that you always have a better overview of the total supply need. Towards the end of the season, the order forecast makes it easier to ramp down the products effectively as well as identifying potential overstock items in the supply chain. |
| Changes in distribution | The order forecast automatically considers changes in distribution. If, for example, a product’s catalogue classification is updated (and it begins to be sold in more or fewer stores than before), the order forecast is updated automatically. Furthermore, if a certain group of customers will be served via another sales channel in the future (e.g. via a different supplying warehouse than previously), this is automatically shown in the order forecasts in the supply chain. |
| Changes in the delivery schedule | The order forecast automatically considers the delivery schedule, which means that the effect of factors like bank holidays or more frequent deliveries during high-season are automatically calculated and shown in the forecast. |
The order forecast is an important tool in controlling the supply chain during new product launches and ramp-downs, when managing seasonal products, in conjunction with marketing efforts, such as campaigns and promotions, and when the delivery schedule is changed.
For example, when launching new products, a good order forecast allows the central warehouse forecast to be adjusted up or down automatically where demand is higher or lower than expected, even before a single replenishment order has been placed by stores.
Order forecasts have multiple areas of application
Using order forecasts, you can also achieve other benefits over and above a faster response to changes in demand and a more balanced total inventory in your own supply chain. RELEX customers have found that by passing on their order forecasts to their suppliers they can also help their suppliers quantify their stock requirements more accurately and thus deliver better service and fresher goods.
Simulations of future goods flow can also be used for internal capacity planning. By better estimating how many rows need to be received or picked on different days, or how the stock volumes will fluctuate in the future, it is possible to deploy one’s workforce and transport better and to anticipate situations where there’s a risk that central capacity limits may be exceeded.
RELEX customers in the convenience goods trade have, among other benefits, seen major improvements in planning goods flows in relation to bank holidays — situations where demand often rises at the same time as the number of delivery days is reduced — with the result that bottlenecks are created by the lack of picking or transport capacity despite the goods being available.
The three reasons to use POS data in your supply chain
The potential for using POS data to help manage the supply chain has finally become a reality:
- The development in data technology has made it possible for any retail company to collect, supply and analyse POS data. Access to POS data makes it possible to react to changes in demand considerably faster.
- Leading retailers have already taken the following steps towards creating order forecasts that integrate the information in POS data, current stock levels and all other relevant control parameters affecting the flow. Order forecasts can radically improve the forecast accuracy for central warehouses and suppliers, particularly when launching new products and ramping down old ones, for seasonal goods and in connection with bank holidays and marketing activities. Order forecasts place high demands on both system support and the calculation capacity, but those companies using modern goods replenishment systems have access to automatic order forecasts and continuous order simulations.
- The development options are not limited only to that part of the supply chain controlled by the company itself; a number of retailers have already taken an extra step forward in development and have begun sending order forecasts to external suppliers. In this way, they can profit from a better level of service and fresher goods.
Are you twiddling your thumbs waiting for a future that has already arrived?
Start using POS data for demand-driven replenishment
At RELEX, we have a long track record of developing the use of POS data and order forecasts in the supply chain. Using our flexible and user-friendly replenishment solutions you can react faster and balance your overall stock correctly in the supply chain. Reach out to find out how we can help you to improve product control at your company — a one-hour meeting is sufficient to explore your company’s particular challenges and define your next steps towards an even better supply chain!
Written by

Related Articles

Safety stock: What it is, how to calculate it, and how to optimize it
Learn how to calculate safety stock and how predictive planning software from RELEX automatically optimizes inventory against demand spikes and supply delays.

Phantom inventory: What it is, what causes it, and how to fix it
Phantom inventory costs retailers in stockouts, spoilage, and wasted labor. Learn what causes it, how to detect it, and how RELEX eliminates it.
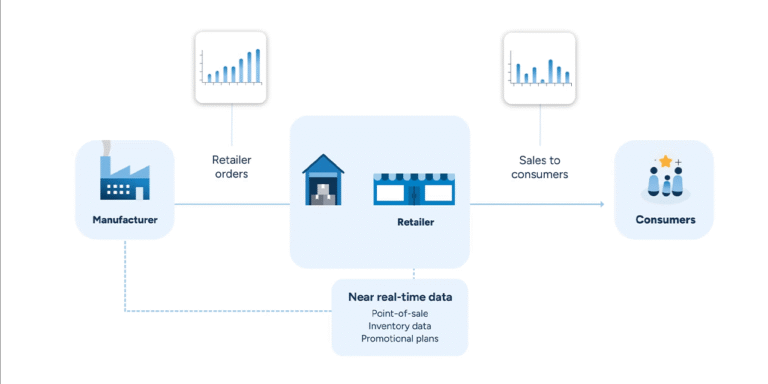
RELEX Retail Connected Planning: Make decisions before the gaps appear
See how RELEX uses near real-time store-level data to help manufacturers spot demand shifts as they happen and allocate stock where it matters most.