Boost sales and profitability through automated, store-specific planogram optimization
Apr 17, 2023 • 7 min
When managing a category across hundreds or thousands of store locations and a diverse set of customers, how can you get the benefits of central planning while also adapting to store-specific needs—without defaulting to planning based on averages?
The answer is store-specific retail planograms, enabling assortment, inventory, and space allocation variations to meet each store’s needs.
“But wait,” I hear you cry. “Creating hundreds or even thousands of store-specific planograms is impossible!”
This is true, and it is the reason that automation is the other necessary component in this process. With automation, central planning teams can create a high volume of accurate planograms adapted to store needs. These localized planograms have multiple benefits, including decreasing out-of-stocks and overstocks, reducing inventory costs, and improving store operational efficiency—replenishment, for example.
In this whitepaper, we’ll dive further into automated store-specific planogram optimization and the benefits this type of localized planning strategy can facilitate in all areas of a retail business.
Why do averages-based planograms fail?
From large chains to small, retailers know that stores of the same size and in the same cluster (i.e. stores with similar demand patterns) can vary dramatically in sales density. Thus, using averages to plan means that you are never truly meeting the needs of a particular store and its customer base because every planogram is sub-optimal, leading to missed sales through assortment gaps and stock-outs that can have much wider ramifications.
Implementation compliance is typically poor for averages-based planograms. Each store will make alterations to accommodate the mismatch between the planogram and the actual space, which means discrepancies in planned facings, leading to stock-outs. At the same time, inventory sits in the back room rather than on the shelf. At the opposite end of the spectrum, too much space leads to a planogram being over-faced, resulting in unattractive displays or low stock turns.
Even when the space matches up, reliance on averages for planogramming means that overstocks or understocks will occur far more frequently than they would with store-optimized planograms. It is crucial to reduce these inefficiencies and ensure that inventory is adjusted to accurately fit and fill each space based on customer demand, as this dynamic can vary even within a minimal geographical area.
For example, imagine two similarly sized stores located within blocks of one another. Store 1 has very high breakfast cereal sales in relation to space, while Store 2 has a lower sales-to-space ratio for the category.
As shown in Figure 1, each store’s required inventory to meet the cereal demand differs. The retailer needs to ensure that cereal out-of-stocks are reduced in Store 1 while at the same time avoiding overstock in Store 2. However, this process becomes complicated because both stores use the same average-based planogram.
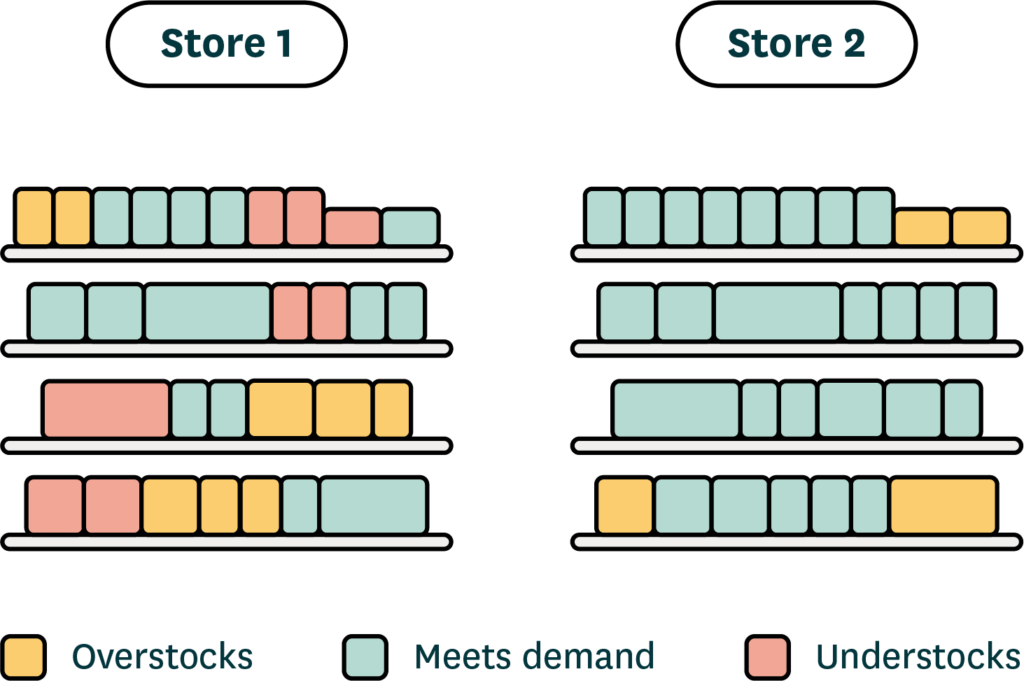
Figure 1: Both Store 1 and Store 2 carry the same cereal assortment in the same planogram. Store 1 is understocked in several areas (highlighted in red). Store 2 follows the national average across the chain, so most of its stock levels meet demand properly (highlighted in green), but it also has a few overstocks (highlighted in yellow).
Planogram optimization can reduce costs and increase sales
All retailers know that the costliest inventory is inventory that isn’t turning because it accumulates costs and capital interest without generating profits through sales. Centrally designed planograms encourage excessive stock of many lines because they do not consider stores’ local demand.
Planograms that reflect the forecasted local demand help optimize batch sizes and delivery schedule efficiencies throughout the supply chain. This optimization can then lead to increased stock turns. In practice, food retailers can see up to a 3% increase in sales with store-level planograms.
With local planograms, retailers often see an immediate 2-10% reduction in stock, depending on the format size and limiting factors on the optimization. For example, the smallest convenience-store formats, where almost all products have only one facing, experience minimal impact, while larger format stores, which have more space to play with, tend to see the largest falls in inventory value.
Even fresh products benefit from this localized approach. No retailer wants their presentation to look sparse, but filling shelves with slow-to-sell pre-packed meat or cold cuts is not good business and can lead to waste. Optimizing shelf space for goods at risk of spoilage for a particular store can decrease waste by up to 10%.
Therefore, optimizing planograms at the store level can drive costs down and increase sales by:
- Reducing handling costs. One-touch replenishment increases efficiency in stores and the upstream supply chain.
- Decreasing inventory-related costs, such as inventory carrying cost and wastage.
- Improving shelf availability. Fitting space to demand reduces restocking and lost sales from errors or late restocking. Customers cannot buy items if they are in the stock room rather than on display.
- Improving item placement. When best-selling items have more space and an optimal location, it is easier for customers to buy them.
It should be stressed that store-level planogramming and stock optimization can be carried out with a completely centralized assortment along with any cluster or store-specific assortment. The idea is to optimize the shelf space for each product in each store based on its sales volume, margin contribution, pack size, and delivery frequency.
Improve store replenishment efficiency and the upstream supply chain
The most significant efficiency gains from locally optimized planograms are made by optimizing store shelving and reducing in-store handling through a one-touch replenishment model. When shelf space is configured accurately to incoming stock, each replenishment delivery can be stacked immediately on display units, achieving one-way inventory.
This approach lowers costs because:
- Staff don’t have to take excess stock to the back room after filling shelves.
- Staff can use back rooms that are not overfilled with excess inventory more efficiently.
- Staff don’t need to restock fast-selling products as frequently.
The impact of store-level planogramming on food retailers’ costs can be significant. The physical handling of stock often accounts for as much as 30% of store labor costs—the most significant labor-related expense after checkout staffing. Planograms created for individual stores can lead to a 5-10% reduction in the labor costs associated with shelf replenishment.
Automating store-level planogram optimization saves valuable planning time
Store-level planogram optimization seems like a no-brainer. Higher sales margins with lower costs—what’s not to like? The critical factor holding retailers back is the perception that creating and optimizing planograms is challenging and time-consuming. They often anticipate that implementation projects will be long and drawn out, with uncertain outcomes and high costs.
Consider a retailer with 1,000 stores, each with five planograms that must be updated weekly due to product switches or category reviews. If one planner builds ten planograms daily, the retailer would need 100 planners to handle these tasks in an average week. The retailer must also manage the ongoing training required to ensure the planning team keeps up with its game.
All this work is just not feasible for most retailers. However, automation can solve many of these issues, relieve planner concerns, lighten the planning team’s load, and remove the barriers to implementing store-specific planogramming. By automating planogram optimization, users can configure any parameters and apply them en masse to thousands of planograms. Therefore, the retailer will not incur an additional cost for adjusting a planogram’s inventory to reflect layout and local consumer preferences—and they will save money.
Moreover, today’s technology and automation can radically reduce the labor involved in store-level optimization. The result is further cost reduction, while planners can reallocate their time to more value-adding tasks.
Automation in the category management process also improves planogram maintenance. For example, large grocers typically conduct a major category review every 12-26 weeks, while weekly reviews address minor changes, such as product introductions and ramp-downs. Automated planogram creation essentially eliminates the time and cost barriers to category management at the store level.
Until recently, software with enough configurability to automatically build and optimize accurate store-level planograms did not exist. Now, technologically advanced solutions allow for this automation to create planograms based on a retailer’s merchandising guidelines and each store’s demand profile. Such automated planograms, tailored to the needs of individual stores based on localized forecasts, are highly accurate and extremely effective.
Let’s return to the earlier example of Stores 1 and 2. By introducing automated planograms individually optimized for each store, cereal overstocks and out-of-stocks have been eliminated, as shown in Figure 2. The store-specific planograms adjust space for cereal in both stores to fit more accurately while helping to tailor replenishment for each to ensure that the deliveries fit the shelves.
Implementing automation to create store-specific planograms has the potential to reduce the central planning team’s time spent on manual work by up to 25%, based on RELEX’s experience with retail customers. Further, automation enables this time saving even though the number of planograms the team must manage increases.
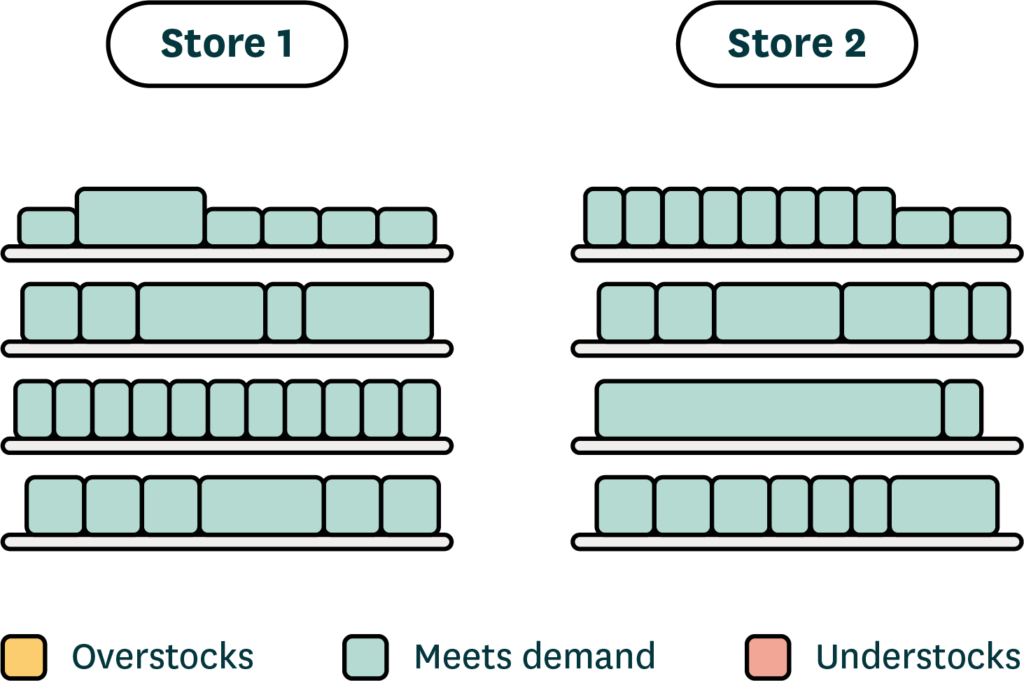
Figure 2: Store 1 and Store 2 with store-specific planograms for cereal in place. By implementing localized planograms, Store 1 and Store 2 have nearly eliminated overstocks and out-of-stocks of cereal. Each store is now optimized for its unique demand pattern (highlighted in green).
Quickly reap the benefits of localized planogram optimization
A quick and painless way to measure a retail operation’s benefits is to pilot localized planograms in a selected subset of stores. Typically, the pilot will highlight that the benefits of such a strategy outweigh the effort and expense of implementation so heavily that the business case is irresistible. For example, East of England Co-operative Society, the UK’s fourth-largest consumer cooperative, increased availability by 5% with store-specific planograms.
Based on RELEX’s experience with our clients, we have seen that automated, store-specific planogramming can increase sales by up to 3% and decrease waste by up to 10%. Implementing automated and localized planograms is low risk and cost with high potential for benefits that deliver rapid results. So, what are you waiting for?
Written by

Related Articles

Safety stock: What it is, how to calculate it, and how to optimize it
Learn how to calculate safety stock and how predictive planning software from RELEX automatically optimizes inventory against demand spikes and supply delays.

From knowing to doing: How RELEX agents close the gap in retail planning
Discover how RELEX agents close the gap between knowing and doing in retail planning, from inventory to promotion optimization.
Case Study: bp
Like many forecourt operators, bp wants to maintain strong on-shelf availability while minimizing excess supply, both at store level and its distribution center (DC) network.